
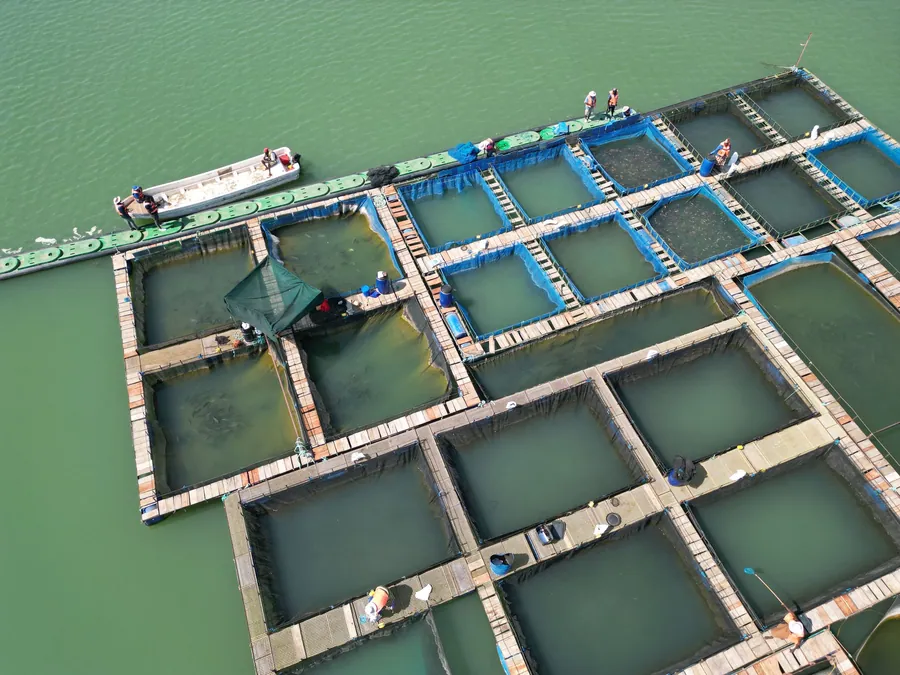
Fisheries and Aquaculture, From Hatchery to Market.
Africa lands 12% of the world’s wild catch but farms only 2% of its aquaculture, and imports a third of the fish it eats. This briefing explains how African fisheries and fish farming work, stage by stage, and where investment changes the economics.
- 13.2m t
of fish and other aquatic animals produced in Africa in 2024, about 7% of world output.
FAO, 2026 (2024 data)- 2.4m t
farmed in Africa in 2024, more than six times the level of 2000.
FAO, 2026 (2024 data)- 33%
of the fish available to eat in Africa in 2023 was imported.
FAO, 2026 (2024 data)
A Large Catch, a Small Farm Sector.
- Main species
- Nile tilapia and African catfish farmed; sardinella, mackerel, hake, octopus and shrimp caught
- Leading producers
- Morocco, Nigeria, Mauritania, South Africa and Senegal at sea; Egypt, Nigeria, Ghana, Uganda and Zambia in farming
- Value chain
- Hatchery, feed, grow-out, harvest, processing, cold chain and markets
- Where we work
- Sierra Leone and Guinea, with visits to landing sites, farms and cold stores
Fish provides about 19% of Africa’s animal protein, the second-highest share of any region, yet each African had 9.1 kg available in 2023 against 21.1 kg worldwide. Supply is short, and a third of it is imported.
Most of Africa’s production is wild catch, about 82% in 2024. Marine fleets work the productive waters off Morocco, Mauritania, Senegal and Namibia, and inland fisheries on Lake Victoria and the other great lakes land almost 30% of the world’s inland catch. Many stocks are under pressure: in the Eastern Central Atlantic off West Africa, only 47.1% of assessed stocks were within sustainable limits in 2023.
Aquaculture is where the growth is. African fish farming grew more than sixfold between 2000 and 2024, led by Egypt, which farms two thirds of the continent’s total, then Nigeria, Ghana, Uganda and Zambia. Cage-farmed tilapia on Lake Victoria alone reached 134,000 tonnes in 2024, more than four times the 2015 level.
The business turns on a few inputs and a cold chain: quality fingerlings; feed, which is at least 60% of the cost of producing tilapia; ice and refrigeration from landing to market; and, for exports, approval to sell into demanding markets such as the EU.
Short Supply, Strong Demand.
Africans eat less than half the fish the average person eats worldwide, and fish still supplies a larger share of animal protein in Africa than almost anywhere.
- 9.1 kg
of fish available per person in Africa in 2023, against 21.1 kg worldwide.
FAO, 2026 (2024 data)- 19%
of Africa’s animal protein came from fish and other aquatic foods in 2023.
FAO, 2026 (2024 data)- 6.1m
people worked in Africa’s fisheries and aquaculture in 2024, 9.3% of the world total.
FAO, 2026 (2024 data)- US$8.4bn
of aquatic products exported from Africa in 2024; imports were 4.0 million tonnes.
FAO, 2026 (2024 data)
Fish Farming, Stage by Stage.
Fish farming runs in sequence, and each stage is a business with its own risks and its own investors. A weak link anywhere spoils the fish at the end, so serious operators look at the whole chain before they build any part of it.
Hatchery and fingerlings
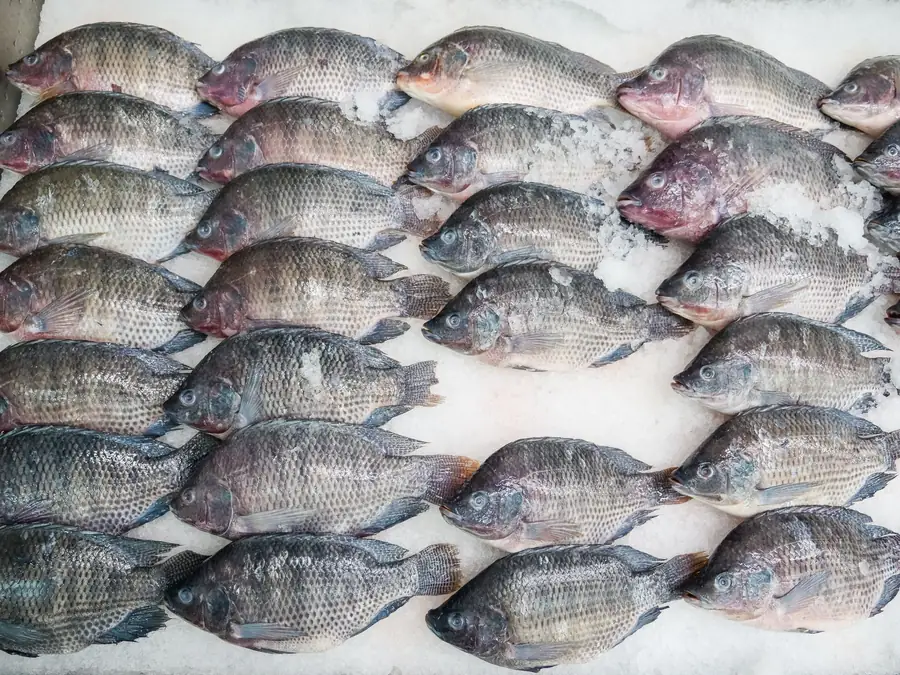
Broodstock fish are spawned and the fry raised to fingerlings for stocking. Reliable, fast-growing fingerlings are a common bottleneck. Improved tilapia lines such as WorldFish’s GIFT strain gain around 10% in growth with each generation.
Where capital goesHatcheries with managed broodstock, and improved strains from recognised breeding programmes.
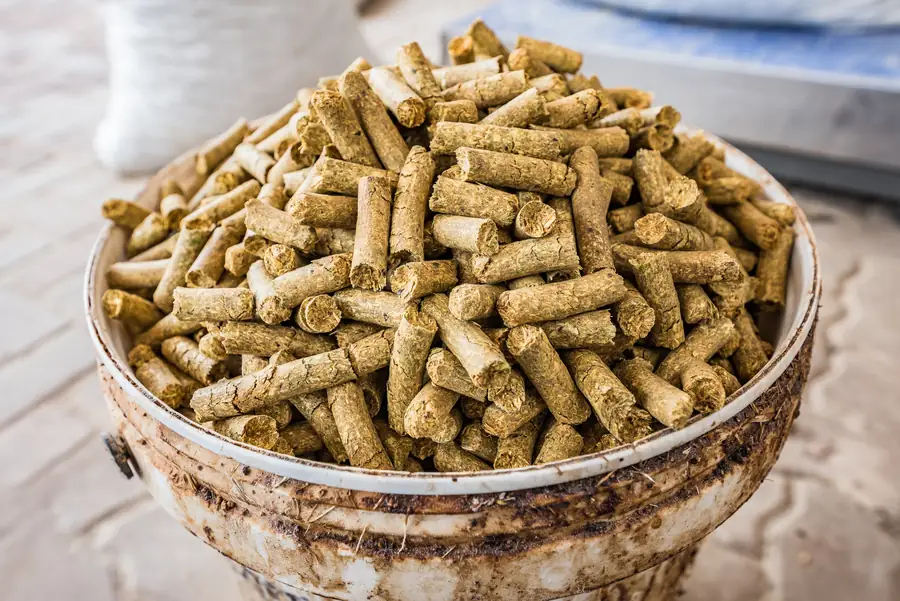
Feed
Feed is at least 60% of the cost of producing tilapia in Sub-Saharan Africa, and 75% to 85% for catfish raised in tanks, by FAO figures. Imported feed ties farm margins to the exchange rate.
Where capital goesLocal feed mills using maize, soybean and by-products, and floating extruded feed.
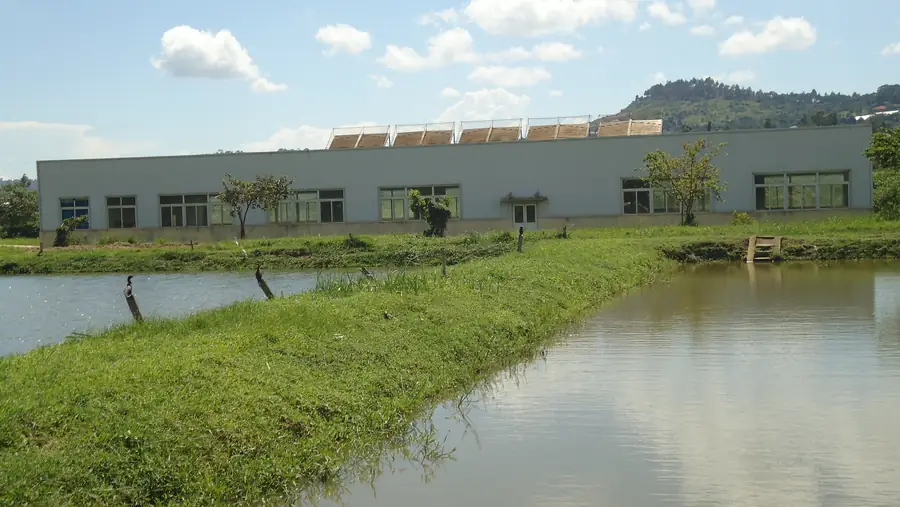
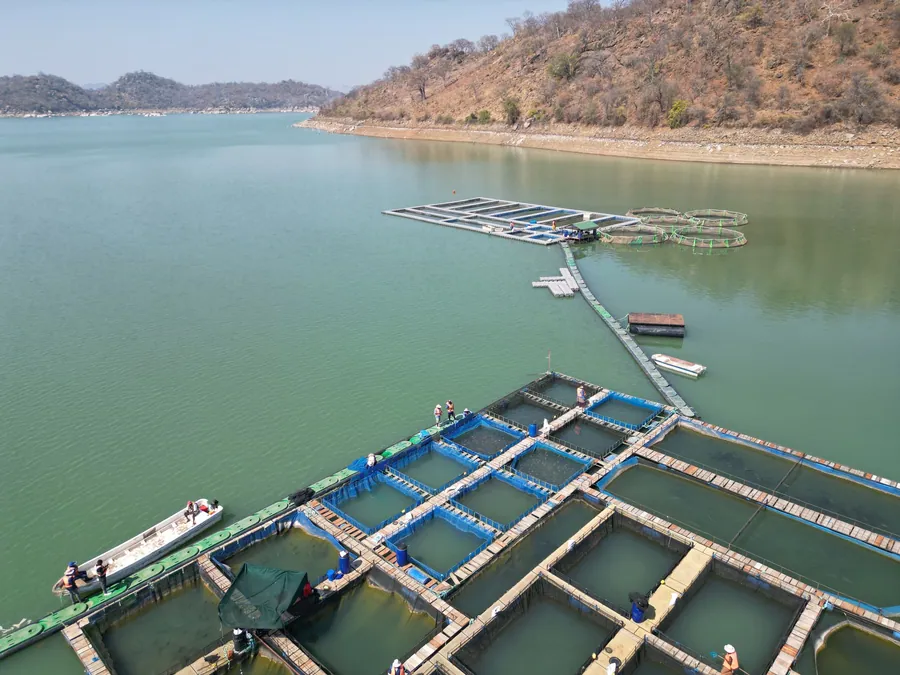
Grow-out in ponds, tanks or cages
Nile tilapia reach 400 to 500 g in five to eight months in semi-intensive ponds; African catfish can grow from 1 g to 800 g in seven months at 26 to 28 °C. Cages on lakes and reservoirs scale fastest, where water quality and zoning allow.
Where capital goesPond and tank farms near city markets, and licensed cage sites on lakes and reservoirs.
Harvest and landing
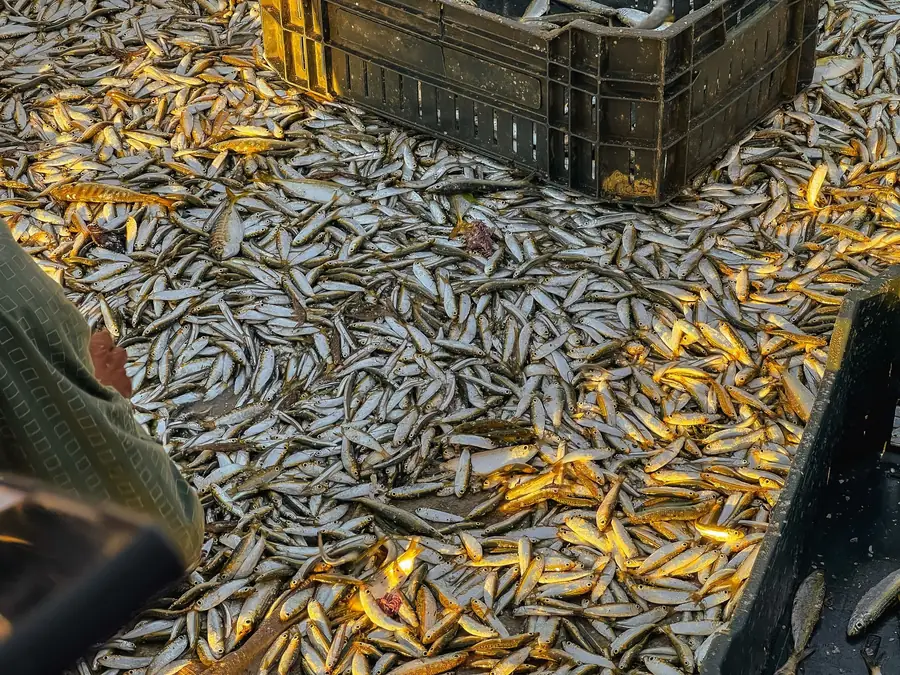
Farmed fish are harvested to order; wild fish come ashore at ports and beach landing sites, much of it from wooden canoes. How fish is handled in the first hours decides its value.
Where capital goesLanding site facilities, ice plants and harvesting equipment.
Processing
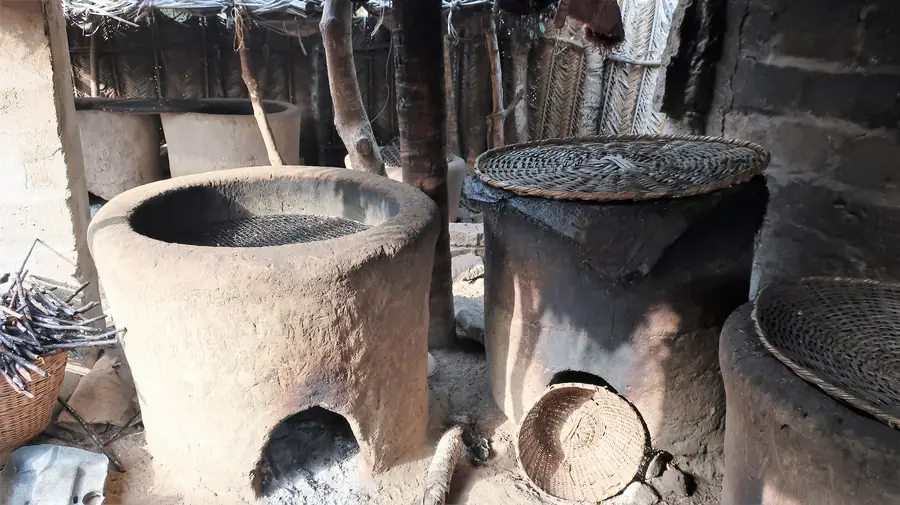
Gutting, filleting, smoking, drying and freezing. Smoked and dried fish dominate West African markets; frozen whole fish and fillets serve supermarkets, institutions and export.
Where capital goesProcessing plants built to hygiene and certification standards, and cleaner, more efficient smoking ovens.
Cold chain and logistics
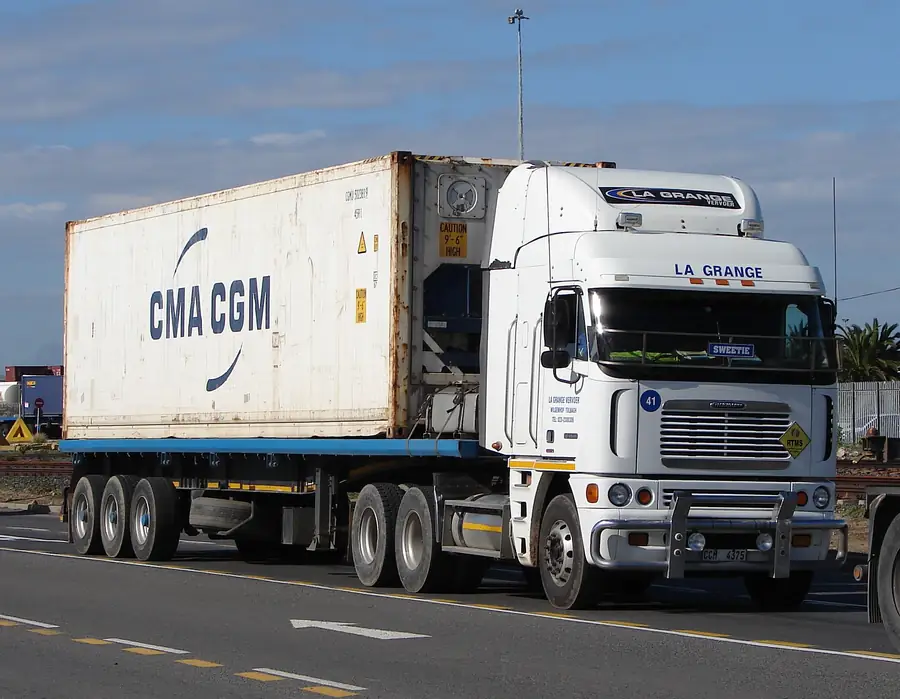
Ice, chillers, cold stores and refrigerated transport. FAO field studies in five Sub-Saharan countries found that loss of quality, not physical loss, made up more than 70% of post-harvest losses.
Where capital goesCold stores, ice plants, refrigerated trucks and solar-powered cold rooms at landing sites.
Markets and export
Most fish is sold within Africa, fresh, smoked or frozen. Africa exported 3.0 million tonnes of aquatic products worth US$8.4 billion in 2024. Selling to the EU requires a listed country, an approved establishment and health certificates.
Where capital goesDistribution, retail and export businesses with traceability and the right approvals.
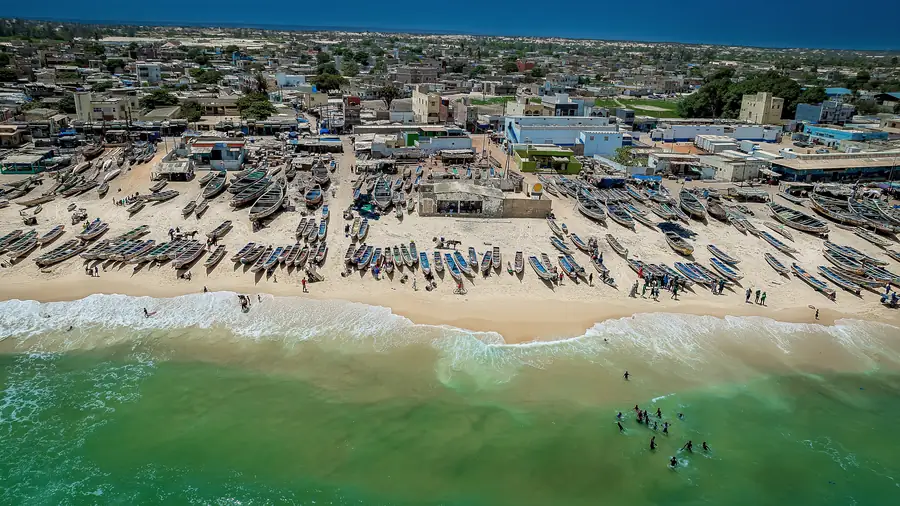
Africa has nearly 18% of the world’s fishing vessels and 42% of its boats without engines.
Much of West Africa’s catch still comes ashore in wooden canoes, which is why ice, landing sites and cold chains change incomes so quickly. FAO, 2026.
Coasts, Lakes and Fish Farms.
Choose a layer: sea and inland catch by country, fish farming by country, or the great inland fisheries.
Capture production, marine and inland, 2024, tonnes (FAO data via the World Bank)
- 01Morocco1,426,661 t
- 02Nigeria855,310 t
- 03Mauritania640,322 t
- 04South Africa521,938 t
- 05Senegal500,077 t
- 06Ghana496,159 t
- 07Guinea384,261 t
- 08Namibia381,230 t
- 09Sierra Leone208,810 t
- 10Liberia26,764 t
Capture totals from the World Bank combine marine and inland catch. FAO notes that the five largest African fish farming countries produce nearly 90% of the continent’s aquaculture.
What It Takes to Sell Beyond the Beach.
Reaching supermarkets, institutions and export buyers depends on approvals, hygiene and evidence as much as on the fish.
EU market access
Fishery products enter the EU only from listed countries, through establishments approved by the national authority, with health certificates. Guinea, Ghana, Senegal, Mauritania and Côte d’Ivoire are listed for wild-caught fish; Sierra Leone and Liberia are not.
Illegal fishing cards
The EU pre-identified Sierra Leone in April 2016 and Liberia in May 2017 for weak controls on illegal fishing, and neither card had been lifted in the Commission’s May 2024 overview. Guinea was listed in 2014 and cleared in 2016.
Food safety
Hygiene systems based on HACCP, traceability and residue testing are the baseline for export and supermarket buyers, and increasingly for large buyers at home.
Certification
ASC certifies responsibly farmed fish and MSC certifies sustainable wild fisheries. Some international buyers require one or the other.
Sustainable stocks
Regional scientists confirmed sardinella as overexploited off Northwest Africa, and a 60% cut in fishing pressure has been set. Fish farming and less waste take pressure off wild stocks.
47.1%of assessed stocks in the Eastern Central Atlantic were within sustainable limits in 2023.
FAO, 2026 (2024 data)Licences and zoning
Vessels, processing plants, farms and cage sites each need their own licences. On Lake Victoria, zoning for cage farming now guides where farms may go.
Where Investment Changes the Economics.
The weakest links in the chain are also the clearest opportunities: fingerlings, feed, ice and cold storage.
Hatcheries
Reliable, fast-growing tilapia and catfish fingerlings for the farms that already exist and the ones being planned.
- Typical entry
- A hatchery near a cluster of fish farms, with managed broodstock.
- Verify first
- Broodstock origin, water supply, biosecurity and farmers’ demand.
Feed mills
Floating feed made from local maize, soybean and by-products, replacing imported feed priced in foreign currency.
- Typical entry
- A feed mill sized to regional demand, with a distribution network.
- Verify first
- Raw material supply and price, power, and farmers’ ability to pay.
Cage and pond farms
Commercial tilapia and catfish farms in ponds near cities or in licensed cages on lakes and reservoirs.
- Typical entry
- A licensed site with tested water and secure access.
- Verify first
- Water quality, zoning and licences, security against theft, and disease controls.
Ice and cold chain
Ice plants, cold rooms and refrigerated transport at landing sites and markets, often solar powered.
- Typical entry
- Facilities with throughput agreements from traders and processors.
- Verify first
- Power, committed volumes and maintenance.
Processing for wider markets
Plants that freeze, fillet or improve smoking for supermarkets, institutions and export.
- Typical entry
- An approved establishment, in a country listed for the target market.
- Verify first
- Authority approval, HACCP systems and the legal origin of the fish.
Fishing port services
Ice, cold storage, repairs, fuel and supplies around new or upgraded fishing ports.
- Typical entry
- A concession or lease beside the port.
- Verify first
- Port status and timetable, concession terms and vessel traffic.
What Fish Businesses Have to Manage.
Fish is perishable, stocks are shared and markets are regulated. These are the issues that decide whether a fisheries investment works.
Stocks and illegal fishing
Many West African stocks are overexploited, and illegal fishing undermines both catches and a country’s access to export markets.
How it is managed: Buy only from licensed vessels and documented catch, favour farming and underused species, and support traceability.
Disease and biosecurity
Disease outbreaks can wipe out a farm’s stock, and moving fish between sites spreads them.
How it is managed: Certified fingerlings, quarantine, veterinary support and stocking densities the site can carry.
Feed cost and currency
Feed is the largest cost, and imported feed moves with the exchange rate.
How it is managed: Local feed supply, careful feeding to improve conversion, and contracts that share price risk.
Cold chain and power
Without ice and refrigeration, quality falls within hours and with it the price.
How it is managed: Ice and cold storage planned with the farm or fleet, with backup or solar power.
Licences and export approval
Without a listed country and an approved establishment, export markets such as the EU stay closed regardless of quality.
How it is managed: Confirm a country’s listing and the approval path with the competent authority before building for export.
Security and weather
Cages are exposed to theft and storms, and coastal landing sites to rough seas.
How it is managed: Site selection, monitoring, insurance where available and good relations with surrounding communities.
Coastal Fleets and Lake Farms.
Each country’s fisheries look different: a large sea catch here, a lake farming boom there. Sierra Leone first.
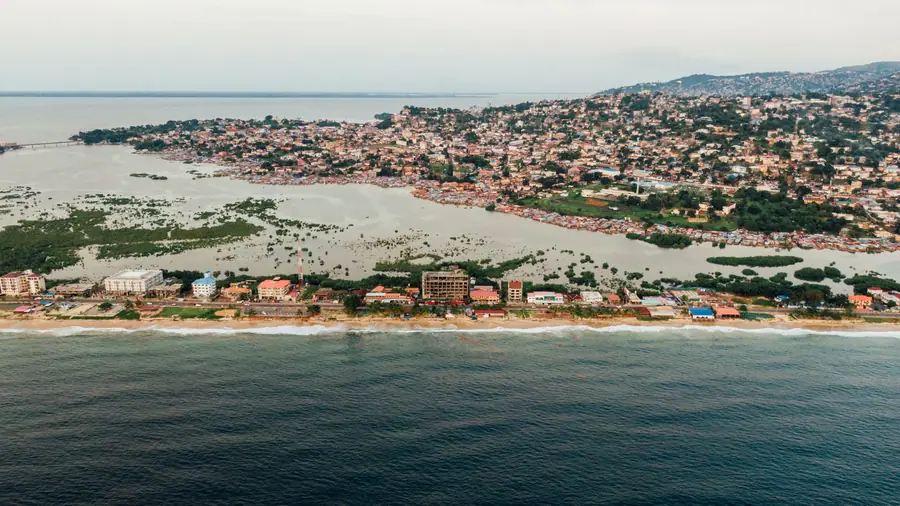
- 13.77%
- fisheries’ share of Sierra Leone’s GDP, per FAO’s country profile. FAO, 2024
- 185 t
- of farmed fish in 2024, against 208,810 tonnes caught. World Bank (FAO data), 2024
Fish is the main animal protein, and the catch is mostly from canoes.
Fisheries contribute 13.77% of Sierra Leone’s GDP, and fish provides around 64% of the animal protein people eat, according to FAO’s country profile. Consumption was 24.2 kg per person in 2021, well above the African average. About 7,500 canoes and 44,000 marine fishers work the coast, with some 27,000 more fishers inland.
The country caught 208,810 tonnes in 2024 but farmed only 185 tonnes, mostly in family ponds. Fish exports were worth US$11 million in 2023, down from US$37 million in 2017. Sierra Leone is not on the EU’s list of countries approved to export fishery products, and the EU’s 2016 yellow card for illegal fishing had not been lifted in May 2024.
New infrastructure is beginning: the President broke ground on an industrial fishing port at Black Johnson in April 2026, funded by a US$55 million grant from China, according to State House.
Egypt
Africa’s fish farming leader, with 1.6 million tonnes in 2024, 66.1% of the continent’s aquaculture, built largely on tilapia.
Nigeria
The second-largest fish farmer, at 258,000 tonnes, more than half of it catfish, and Africa’s second-largest catch at 855,310 tonnes.
Ghana
A growing fish farming sector of 122,000 tonnes, a catch of 496,159 tonnes, and EU listing for wild-caught fish.
Uganda and Lake Victoria
Africa’s largest inland catch, and cage-farmed tilapia on Lake Victoria that reached 134,000 tonnes in 2024.
134,000 tof cage-farmed tilapia on Lake Victoria in 2024.
FAO, 2026 (2024 data)Morocco
Africa’s largest catch, 1.43 million tonnes in 2024, with large pelagic and octopus fisheries.
Guinea and Liberia
Guinea caught 384,261 tonnes in 2024 and is listed for EU exports of wild-caught fish after leaving the EU’s illegal fishing list in 2016. Liberia has carried an EU yellow card since 2017.
Ports, Cold Stores and Regional Programmes.
Public projects that show where fisheries infrastructure is being built, and what it costs.
- Sierra LeoneIndustrial fishing port
Black Johnson fishing port
Sierra Leone’s first industrial fishing port, in the Western Area, funded by a US$55 million grant from China, according to State House.
Ground broken April 2026State House, Sierra Leone, 2026 - NamibiaPort cold chain
Walvis Bay cold store
A 12,500-tonne cold store at the port of Walvis Bay, at least three quarters of it for fish, built for about R400 million, per the Namibian Ports Authority.
Opened 2021Namibian Ports Authority, 2021 - Guinea, Sierra Leone, LiberiaWorld Bank programme
West Africa Regional Fisheries Program
The second phase of the World Bank’s West Africa Regional Fisheries Program, a US$22 million commitment for Guinea, Sierra Leone and Liberia, approved in March 2015 and closed in February 2022.
Closed 2022World Bank, 2015 to 2022
Practical Help Along the Chain.
We do not catch, farm or trade fish. We help investors research markets, check sites and partners, and see landing sites, farms and cold stores for themselves.
A first consultation is where we agree the question, the scope and who should be involved. Pick a time that suits you.
Book ConsultationMarket and value chain research
Prices, species, supply, buyers and competitors for a specific market.
Site and partner checks
Verify farms, processors, vessel owners and documents before you commit.
Supplier and buyer introductions
Find hatcheries, feed suppliers, processors and buyers for your plan.
Visits to sites and facilities
Plan and accompany visits to landing sites, farms, cold stores and ports.
Meetings with fisheries authorities
Prepare meeting requests with fisheries ministries, port authorities and regulators, subject to their availability.
Before You Commit, Ask These.
Can fish from Sierra Leone be exported to the EU?
Not at present. Sierra Leone is not on the EU’s list of countries approved to export fishery products, and the EU’s 2016 yellow card for illegal fishing had not been lifted in its May 2024 overview. Guinea, Ghana and Senegal are listed for wild-caught fish.
Is fish farming profitable in West Africa?
It can be where fingerlings, feed and buyers are reliable. Feed is at least 60% of the cost of producing tilapia in Sub-Saharan Africa, so the feed price and how efficiently fish convert it decide the margin.
Which fish are farmed in Africa?
Mainly Nile tilapia and African catfish. Tilapia reach 400 to 500 g in five to eight months in semi-intensive ponds, and African catfish can grow from 1 g to 800 g in seven months in warm water.
How large is Africa’s aquaculture sector?
Africa farmed about 2.4 million tonnes in 2024, 2% of the world total. Egypt produced two thirds of it, followed by Nigeria, Ghana, Uganda and Zambia.
Where is the biggest loss in the fish value chain?
In quality after landing. FAO field studies in five Sub-Saharan countries found that quality losses made up more than 70% of post-harvest losses, which is why ice, cold storage and processing matter.
Talk to Us About Fisheries and Fish Farming.
Tell us the site, the species or the market. We will tell you plainly what to check first.
Where the figures come from
- Implementing Regulation (EU) 2021/405, Annex IX: countries authorised for fishery products
European Union, consolidated 2026 - President unveils Sierra Leone’s first industrial fishing port at Black Johnson
State House, Sierra Leone, 2026 - West Africa Regional Fisheries Program (Guinea, Sierra Leone, Liberia), P126773
World Bank, 2015 to 2022
Reviewed . Figures are quoted as each source states them, with the year they describe; reserves, production and export value are different measures and are labelled as such. Projects named on this page belong to the organisations that run them and are public information, not Capital Africa engagements. Opportunity areas are illustrative.